Trail Mix Graphing Activity for Kids: Math You Can Eat!
This post may contain affiliate links.
Do your kids love snacks? Do they not love math worksheets? Perfect. This edible math activity is the answer. Introducing: The Trail Mix Graphing Activity — the snack that teaches math (or is it the math that earns you a snack?). Either way, it’s a win.
It’s simple, screen-free, and secretly educational. Plus, you get to eat your data when you’re done with the lesson. This is good for kindergarten, first grade or second grade learners. But even 3rd and 4th grade learners enjoy this one!
What Does the Trail Mix Graphing Activity Teach?
-
Sorting – a.k.a. “Why are there more raisins than chocolate chips in my snack?”
-
Counting & tallying – practice for future grocery receipts
-
Bar graphing – because kids will do anything if it involves markers and snacks
-
Comparing quantities – Have them answer questions about their results. “Who got more marshmallows?”
It’s all the good stuff, minus the whining. Hopefully.
What You’ll Need for This Math Activity
You can go with store-bought trail mix or raid your pantry and toss together a mix of whatever hasn’t gone stale yet. Math manipulatives you can eat! Yes!

Some Ideas:
-
Raisins
-
Mini pretzels
-
Cereal (Cheerios, Chex, etc.)
-
Mini marshmallows
-
Sunflower seeds
- Crackers (Goldfish, oyster, etc.)
-
Dried fruit (raisins, cranberries)
-
Chocolate chips
- Popcorn
-
Nuts (optional and allergy-aware, of course)
Keep it to around six items for simplicity (and so you don’t run out of graph space). Mix up your snack mix and scoop them into a bag for each child. 
How to Do the Trail Mix Graphing Activity
-
Sort your snack.
Kids separate each item into piles. Warning: some may disappear mysteriously during this step.
-
Count and tally.
Use the tally chart printable to keep track. Tally marks make kids feel very official. -
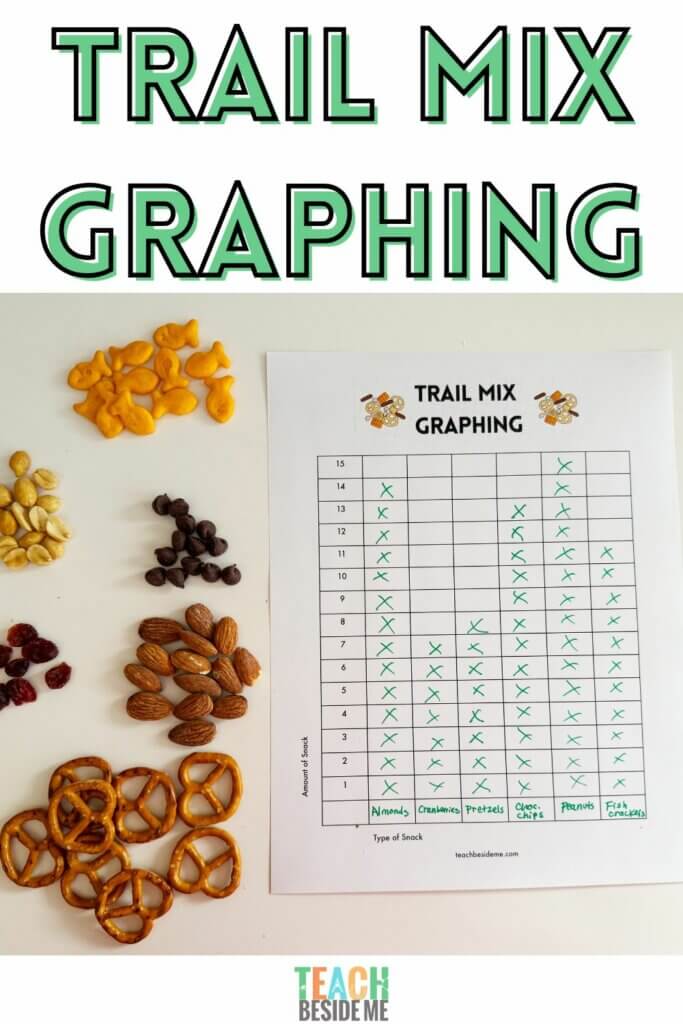
Graph it.
Fill in the bar graph to show how many of each item you had. Extra credit for coloring neatly. (No pressure.) -
Analyze.
Ask questions like:

- Which item was the winner?
- Who got the least of their favorite?
- How many total pieces did you eat… err, count?

Download the Trail Mix Graphing Sheet:
Want To Mix Things Up?
Try these variations:
-
Group graph: Combine everyone’s trail mix and graph it as a team. Math teamwork + snack sharing = life skills.
-
Make a prediction: Guess what you’ll get the most of before opening the bag.
-
Build your own mix: Let kids help choose ingredients and make the mix.
More Edible Learning Ideas
Your kitchen is a classroom. A delicious one. Check these out next:
This trail mix graphing activity is one of those “sneaky learning” activities that kids genuinely enjoy—and it doesn’t take much prep. Plus, you get to say things like “Please stop graphing your pretzels and just eat them.”
Print the sheets, grab a snack, and call it math. That’s the kind of homeschooling we can all get behind.


