Hurricane Mapping STEM Activity for Kids
This post may contain affiliate links.

Today I want to show you how to use a hurricane tracking map and follow the path of hurricanes with your kids. Hurricane mapping is a simple but powerful educational STEM activity that brings geography, weather science, and data skills together in one engaging project.
See also my Hurricane in a Bowl Experiment!

Why This Matters
Hurricane season is a big deal to me. I grew up in Southern Florida, where we prepared every year for storms. I remember tracking hurricanes as they made their way across the ocean—worrying for those in their path and learning the importance of preparation and early warning systems.
While I no longer live in hurricane territory, I still keep an eye on major storms. These weather events are powerful, dangerous, and—most of all—teachable moments. This activity helps kids build awareness of natural disasters, understand how storms move, and practice data mapping skills.
How to Do the Hurricane Mapping Activity
I vividly remember mapping Hurricane Andrew in my middle school science class. Each day, we would check the latest hurricane coordinates and plot them on our tracking charts. It made the science real—and personal.
You can replicate that experience with your kids using just a few tools:
What You Need:
-
A hurricane tracking chart (grab a printable version or use a blank map with latitude/longitude lines)
-
A pen or dot stickers
-
Access to hurricane tracking data (see below)

Where to Find Real Hurricane Data Online
You don’t need a STEM kit to do this activity! Free, real-time data is available online and updated regularly during hurricane season.
Try one of these options:
-
NOAA National Hurricane Center – Best source for official storm forecasts, maps, and historical data
-
HURDAT2 Data – Coordinates for historical hurricanes
-
Zoom Earth – Interactive live tracking map with satellite views
-
Weather Underground Hurricane Tracker – Easy-to-use storm tracking and forecast maps
From these sources, you can find:
-
The name of the storm
-
Its location (latitude and longitude)
-
Wind speed
-
Movement direction
-
Category level on the Saffir-Simpson scale
![]()
Step-by-Step: Map a Hurricane Path
-
Print a hurricane tracking chart with latitude and longitude grid lines.
-
Choose a current or past storm to follow. You can use Hurricane Katrina, Rita, or any current hurricane in the Atlantic or Pacific.
-
Plot the coordinates on your map. Add a dot for each 12 or 24-hour interval. You can color-code days or label them with dates.
-
Track its movement over time and compare how fast it travels, what direction it moves, and how the category level changes.
-
(Optional) Compare two storms and look at differences in their path, wind speed, and areas affected.

Learning Extensions
-
Geography: Practice reading coordinates and identifying regions affected by hurricanes.
-
Math: Calculate distance traveled or rate of movement.
-
Science: Study how hurricanes form and why they follow certain paths.
-
History: Research major hurricanes and their impact on communities.
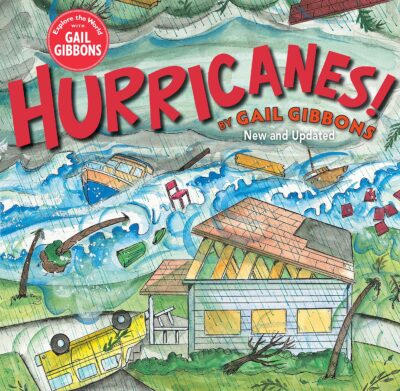
Book Pairing
Extend the learning with the book Hurricanes by Gail Gibbons. It’s an excellent resource for young learners to understand the weather systems behind these storms.
This hurricane mapping activity is a simple yet powerful way to bring science to life. Kids get to see how data tells a story—and how science helps save lives. Whether you’re tracking current storms or studying historic ones, this STEM lesson builds geography, critical thinking, and weather awareness all at once.
See more STEM Projects for Kids.